

Image Details
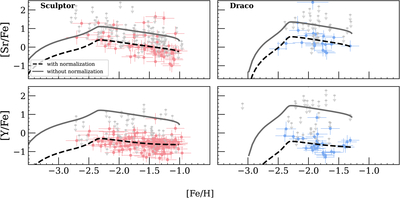
Caption: Figure 9.
[Sr/Fe] and [Y/Fe] as a function of [Fe/H] for Sculptor (left, pink) and Draco (right, blue). Pink and blue points are abundance measurements from DEIMOS, and gray arrows are upper limits. The black line is the best-fit GCE model with NSMs supplying the r-process (the same model as in Figures 3 and 4). The gray lines are GCE models with all of the same parameters, but normSrNSM and normYNSM are set to 1.
Other Images in This Article
Show More
Copyright and Terms & Conditions
© 2026. The Author(s). Published by the American Astronomical Society.

Copyright ©
2026 Astronomy Image Explorer. All Rights Reserved.
