

Image Details
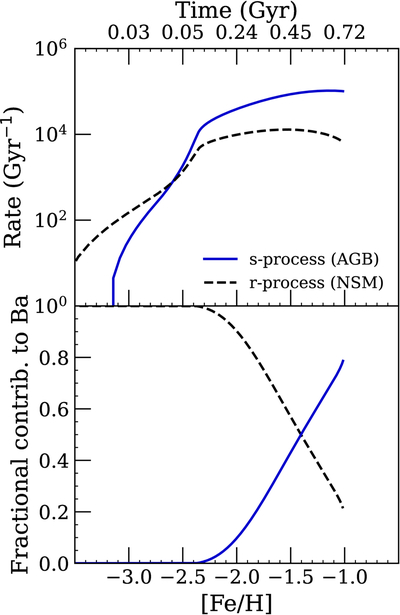
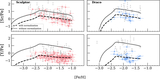
Caption: Figure 8.
Top: s-process (blue, solid line) and r-process (black, dashed line) event rates in Sculptor as a function of [Fe/H] on the lower x-axis and time from the start of the model on the upper x-axis. Bottom: fractional contribution to the Ba enrichment at each time step from s-process and r-process as a function of [Fe/H] and time in Sculptor. The model used in both panels of this figure is given in the first column of Table 3, with only NSMs as r-process sites.
Other Images in This Article
Show More
Copyright and Terms & Conditions
© 2026. The Author(s). Published by the American Astronomical Society.

Copyright ©
2026 Astronomy Image Explorer. All Rights Reserved.
