

Image Details
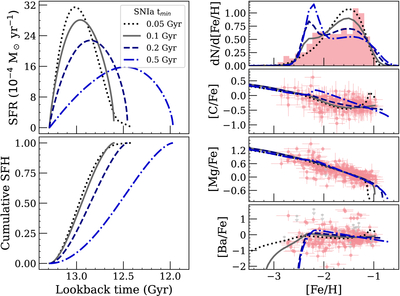
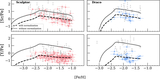
Caption: Figure 2.
Left: star formation rate over time (top) and cumulative star formation history (bottom) for four different GCE models for Sculptor. Each model has a different SNIa minimum delay time, ﹩{t}_{{\rm{\min }},{\rm{Ia}}}﹩, from 0.05 Gyr to 0.5 Gyr. Right: metallicity distribution function (top) and [C/Fe], [Mg/Fe], and [Ba/Fe] as a function of [Fe/H] for Sculptor. Pink points are measurements, and gray arrows are upper limits. Plotted over the measurements are the same four GCE models from the left panels. The models were fit to all the elements in our sample; C, Mg, and Ba are shown as a representative set of elements. Model parameters are given in Table 2.
Other Images in This Article
Show More
Copyright and Terms & Conditions
© 2026. The Author(s). Published by the American Astronomical Society.

