

Image Details
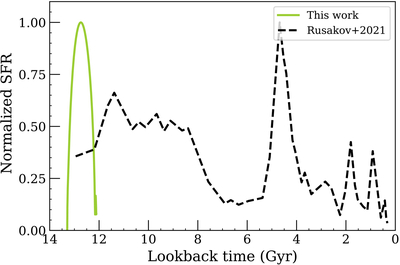
Caption: Figure A1.
Star formation rate normalized to its maximum value as a function of lookback time for the Fornax dSph. The green line is the SFH from our GCE model (parameters given in Table A1), while the dashed black line is an SFH from V. Rusakov et al. (2021).
Other Images in This Article
Show More
Copyright and Terms & Conditions
© 2026. The Author(s). Published by the American Astronomical Society.

Copyright ©
2026 Astronomy Image Explorer. All Rights Reserved.
