

Image Details
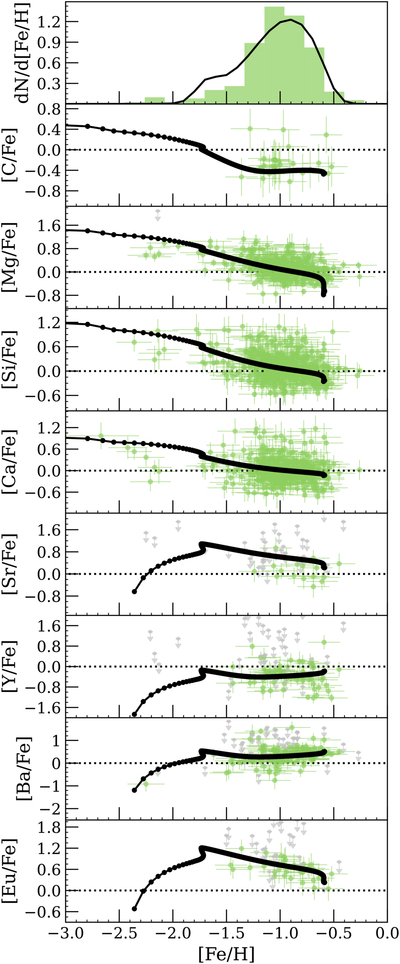
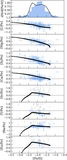
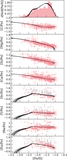
Caption: Figure A2.
Metallicity distribution function (top) and [C/Fe], [Mg/Fe], [Si/Fe], [Ca/Fe], [Sr/Fe], [Y/Fe], [Ba/Fe], and [Eu/Fe] as a function of [Fe/H] for Fornax. Green points are abundance measurements, and gray arrows are upper limits. The black line shows the best-fit GCE model with NSMs as the only r-process source. This is the model that corresponds to the parameters in Table A1.
Other Images in This Article
Show More
Copyright and Terms & Conditions
© 2026. The Author(s). Published by the American Astronomical Society.

Copyright ©
2026 Astronomy Image Explorer. All Rights Reserved.
