

Image Details
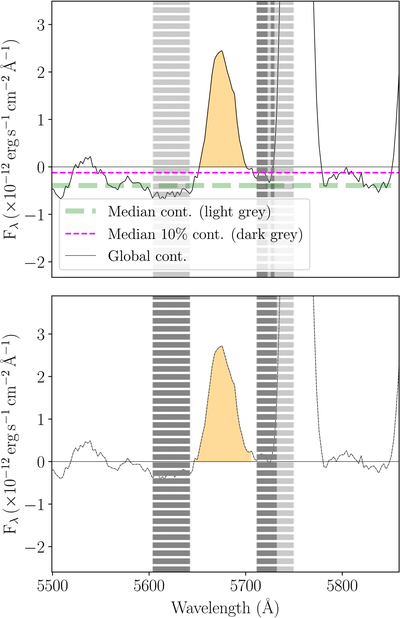
Caption: Figure A2.
Example of the method followed for the determination of the local continuum and measurement of a line flux. Top panel: spectral window of an emission line with global continuum (solid thin horizontal line at zero) and integrated flux (orange shaded area). The thick dashed green line shows the continuum calculated from the spectral apertures at the edge of the spectral window (±80 Å around the rest-frame wavelength of the target line), as denoted by the light-gray regions. The thin dashed magenta line shows the continuum calculated from the edge regions but only for fluxes that are ≤10% of the peak flux of the emission line (dark gray). Since there is some difference between the two lines, we move the spectrum upward with a shift corresponding to this difference. Bottom panel: shifted spectrum with the final continuum determined from the median flux of the edge regions with fluxes that are ≤50% of the peak flux of the emission line (dark gray). This procedure ensure avoiding nearby emission or absorption features.
Other Images in This Article
Copyright and Terms & Conditions
© 2026. The Author(s). Published by the American Astronomical Society.

