

Image Details
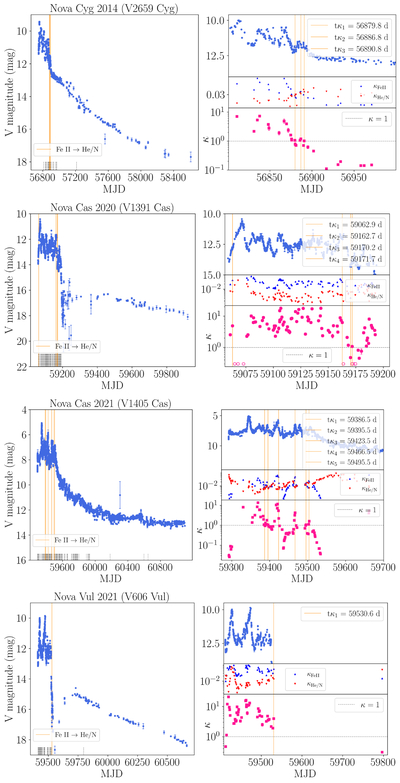
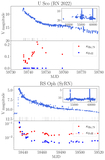
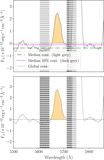
Caption: Figure 2.
Same as Figure 1 but for the novae of our main sample that present oscillatory behavior (jitters). The open circles in the lower-right panel of Nova Cas 2020 correspond to spectra with null flux of the Fe II line. Since these values do not appear in logarithmic scale, we replaced them with very low values in order to show the transition from He/N to Fe II phases and vice versa.
Other Images in This Article
Copyright and Terms & Conditions
© 2026. The Author(s). Published by the American Astronomical Society.

Copyright ©
2026 Astronomy Image Explorer. All Rights Reserved.
