

Image Details
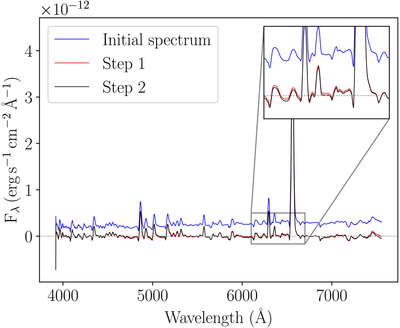
Caption: Figure A1.
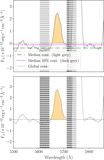
Example of continuum subtraction. The original spectrum is shown in blue, the first-order continuum-subtracted spectrum is shown in red, and the second-order corrected spectrum is shown in black. The horizontal gray dashed line marks the zero-flux level.
Other Images in This Article

Copyright and Terms & Conditions
© 2026. The Author(s). Published by the American Astronomical Society.

Copyright ©
2026 Astronomy Image Explorer. All Rights Reserved.
