

Image Details
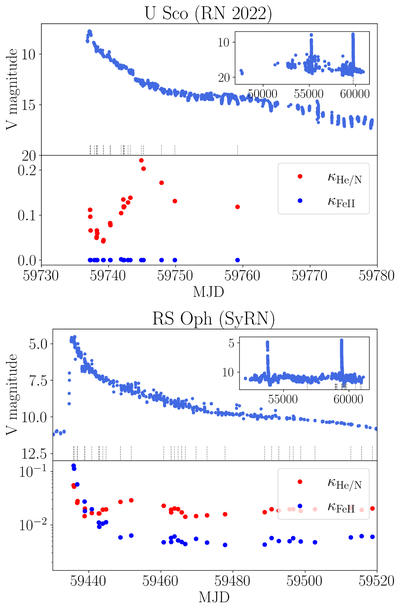
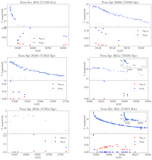
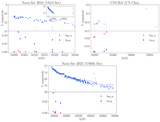
Caption: Figure 5.
Upper panel: V light curves of the recurrent novae of our sample. Lower panel: evolution of κFeII (blue) and κHe/N (red). The gray dashed lines indicate the epochs of the available spectra. Note that for RS Oph, the Fe II flux in the first spectrum is null. Consequently, the corresponding blue point is not shown because the y-axis is on a logarithmic scale.
Other Images in This Article
Copyright and Terms & Conditions
© 2026. The Author(s). Published by the American Astronomical Society.

Copyright ©
2026 Astronomy Image Explorer. All Rights Reserved.
