

Image Details
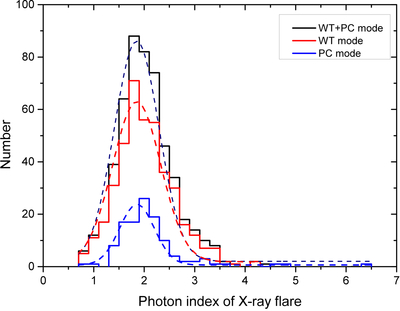
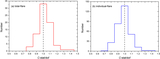
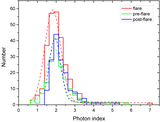
Caption: Figure 7.
Histogram of the photon index distribution of X-ray flares. The black solid line represents data from both WT and PC modes, the red solid line represents data from WT mode, and the blue solid line represents data from PC mode. The dashed lines show the corresponding Gaussian fits.
Other Images in This Article
Show More
Copyright and Terms & Conditions
© 2026. The Author(s). Published by the American Astronomical Society.

Copyright ©
2026 Astronomy Image Explorer. All Rights Reserved.
