

Image Details
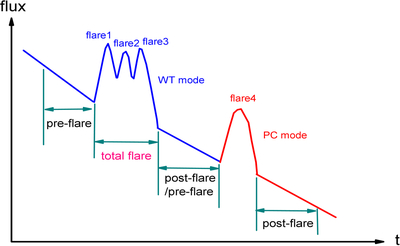
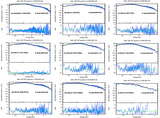
Caption: Figure 1.
Schematic diagram of spectral fitting for X-ray flares and their preflare and postflare phases. The data acquired in WT mode and PC mode are represented in blue and red, respectively.
Other Images in This Article
Show More
Copyright and Terms & Conditions
© 2026. The Author(s). Published by the American Astronomical Society.

Copyright ©
2026 Astronomy Image Explorer. All Rights Reserved.
