

Image Details
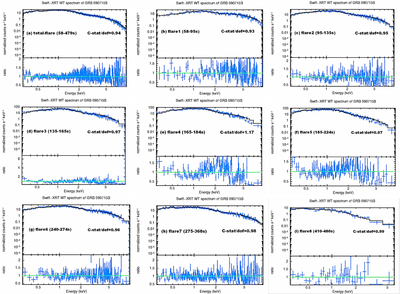
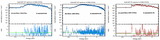
Caption: Figure 5.
X-ray spectral fits for GRB 090715B. (a) Total-flare phase covering 58–479 s; (b)–(i) flares 1–8 respectively. Upper panels: unfolded spectra (data points with 1σ error bars) and the best-fit absorbed power-law model (black solid line). Lower panels: data-to-model ratio. The horizontal solid line marks the ideal ratio of 1.0. The C-stat/dof value for each fit is indicated in each panel. The fitting energy range is 0.3–10 keV.
Other Images in This Article
Show More
Copyright and Terms & Conditions
© 2026. The Author(s). Published by the American Astronomical Society.

Copyright ©
2026 Astronomy Image Explorer. All Rights Reserved.
