

Image Details
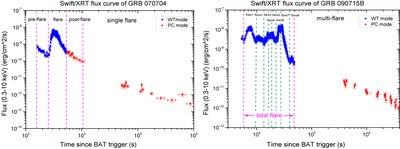
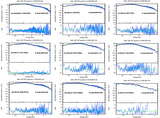
Caption: Figure 2.
Examples of time-sliced spectral analysis for X-ray flares. Left: GRB 070704, a burst exhibiting only a single flare. Right: GRB 090715B, a burst exhibiting multiple consecutive flares. The data acquired in WT mode and PC mode are represented in blue and red, respectively.
Other Images in This Article
Show More
Copyright and Terms & Conditions
© 2026. The Author(s). Published by the American Astronomical Society.

Copyright ©
2026 Astronomy Image Explorer. All Rights Reserved.
