

Image Details
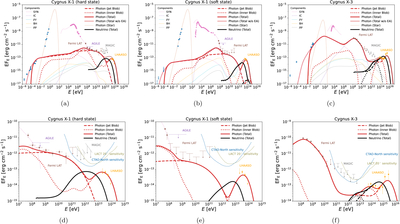
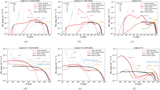
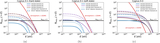
Caption: Figure 4.
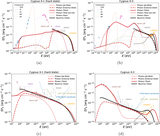
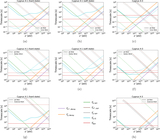
Photon (red) and neutrino (black) spectra obtained from Scenario A. The contributions to the photon and neutrino fluxes are indicated by dashed lines for the jet blob and dotted lines for the inner blob. The solid lines represent the total fluxes, summing the inner and jet blob contributions. Fainter red solid lines show photon spectra calculated without the external absorption (i.e., without including free–free absorption and external γγ annihilation). Additionally, the light thin lines represent various emission components (electron synchrotron, electron IC, pγ, BH, and pp) summed across both regions, as specified in the legend. The dotted orange lines represent the blackbody radiation from the donor star, while the dotted pink lines indicate the de-absorbed X-ray emission from the accretion disk. The bottom row provides a zoomed-in view of the top row. The dashed blue and green-yellow lines show the differential sensitivities for 50 hr exposures of the CTAO Northern Array (https://www.ctao.org/for-scientists/performance/) and the LACT full array at a zenith angle of 20° (Z. Zhang et al. 2025), respectively. The first, second, and third columns correspond to model fits for the hard state of Cygnus X-1 and the soft states of Cygnus X-1, and Cygnus X-3, respectively. Note that the observational data at different energy ranges are not simultaneous.
Other Images in This Article
Copyright and Terms & Conditions
© 2026. The Author(s). Published by the American Astronomical Society.

