

Image Details
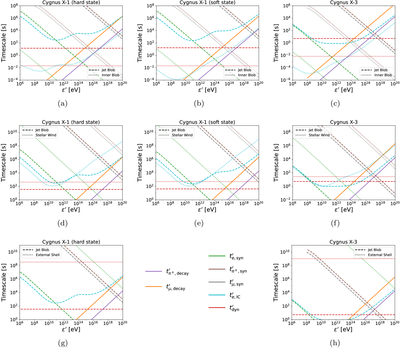
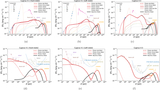
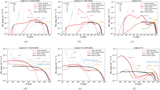
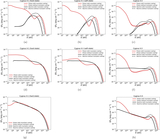
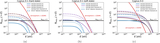
Caption: Figure A1.
Cooling and decay timescales in the comoving frame. Synchrotron emission of electrons, muons, and charged pions is shown in green, gray, and brown, respectively, while electron IC cooling is shown in light blue. The decay timescales of muons and charged pions are indicated by the orange and purple lines, respectively, and the dynamical timescale is shown in red. Colors represent different physical processes, while line styles denote different emission regions, with decay timescales shown as solid lines. The first, second, and third rows correspond to Scenarios A, B, and C, respectively.
Other Images in This Article
Copyright and Terms & Conditions
© 2026. The Author(s). Published by the American Astronomical Society.

Copyright ©
2026 Astronomy Image Explorer. All Rights Reserved.
