

Image Details
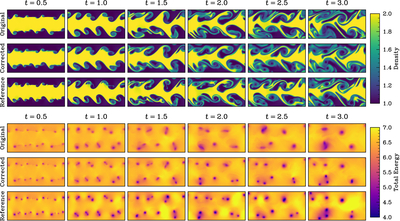
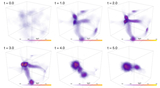
Caption: Figure 17.
A visualization of the Kelvin–Helmholtz flux corrector network on a test initial conditions set. Despite only training our model up until t = 1.0, we are able to maintain numerical stability well past t = 3.0. This is seen both in terms of the recovered density structures as well as the position/number of the vortexes seen in the energy field.
Other Images in This Article
Show More
Copyright and Terms & Conditions
© 2026. The Author(s). Published by the American Astronomical Society.

Copyright ©
2026 Astronomy Image Explorer. All Rights Reserved.
