

Image Details
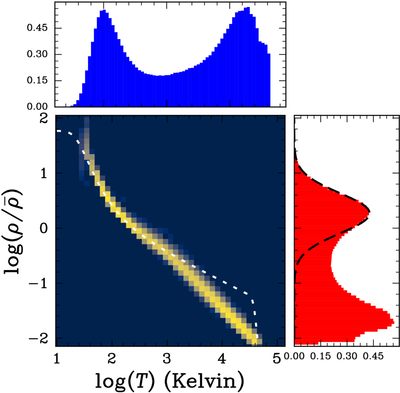
Caption: Figure 4.
Thermodynamic phase structure of the turbulent two-phase ISM. Joint probability distribution of gas temperature and overdensity from the driven, cooling–heating hydrodynamic simulation shown in the accompanying ISM slice (Figure 3) showcasing the biphase structure. Colors indicate the logarithm of the mass-weighted probability density. The dashed curve shows the thermal equilibrium heating–cooling balance for the adopted microphysics. At low temperatures, the gas is roughly at thermal equilibrium and therefore follows the heating/cooling curve. At high temperature, the dense ridge follows an approximately isobaric locus, reflecting turbulent mixing and shock heating rather than local thermal equilibrium. Cold and warm gas accumulate near the stable branches of the equilibrium curve, while hot gas occupies a broad, off-equilibrium tail produced by intermittent turbulent dissipation and long cooling times. Marginalized distributions in temperature (top) and overdensity (right) highlight the bimodal phase structure of the medium.
Other Images in This Article
Show More
Copyright and Terms & Conditions
© 2026. The Author(s). Published by the American Astronomical Society.

