

Image Details
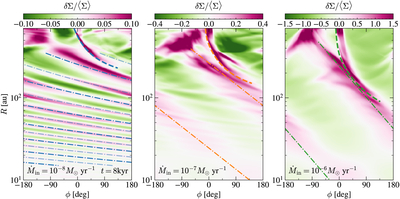
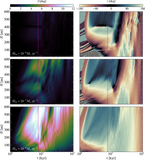
Caption: Figure 6.
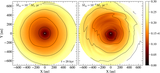
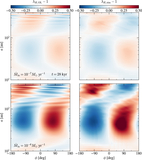
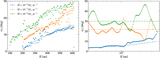
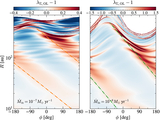
Surface density perturbation δΣ/〈Σ〉, measured at the end of the infall phase (t = 8 kyr) for ﹩{\dot{M}}_{{\rm{in}}}=1{0}^{-8}﹩ (left), 10−7 (middle), and 10−6 M⊙ yr−1 (right). Dashed curves at large radii trace the primary spiral arm, while dotted–dashed lines at smaller radii indicate the locations of the secondary spiral arm.
Other Images in This Article
Show More
Copyright and Terms & Conditions
© 2026. The Author(s). Published by the American Astronomical Society.

Copyright ©
2026 Astronomy Image Explorer. All Rights Reserved.
