

Image Details
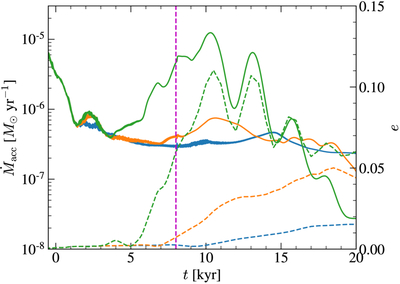
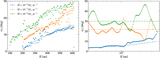
Caption: Figure 10.
Temporal evolution of the stellar accretion (solid lines) and the mean disk eccentricity for a ≤ 10 au (dashed lines) for models with ﹩{\dot{M}}_{{\rm{in}}}=1{0}^{-8}\,{M}_{\odot }\,{{\rm{yr}}}^{-1}﹩ (blue), 10−7 M⊙ yr−1 (orange), and 10−6 M⊙ yr−1 (green). The vertical dashed line indicates the phase where the infall is ceased, similar to Figures 3 and 9. The accretion rate in the ﹩{\dot{M}}_{{\rm{in}}}=1{0}^{-6}\,{M}_{\odot }\,{{\rm{yr}}}^{-1}﹩ model is enhanced by a factor of ∼30 relative to the low-infall-rate models. In addition, it exhibits quasiperiodic variations with a period of ∼3 kyr, which closely track the evolution of the inner-disk eccentricity.
Other Images in This Article
Show More
Copyright and Terms & Conditions
© 2026. The Author(s). Published by the American Astronomical Society.

