

Image Details
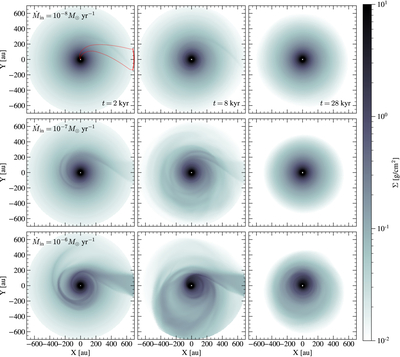
Caption: Figure 2.
Snapshots of the disk surface density at t = 2 kyr (left), 8 kyr (middle), and 28 kyr (right), for infall rates of ﹩{\dot{M}}_{{\rm{in}}}=1{0}^{-8}\,{M}_{\odot }\,{{\rm{yr}}}^{-1}﹩ (top), 10−7 M⊙ yr−1 (middle), and 10−6 M⊙ yr−1 (bottom). The short red arc and red dotted lines in the upper-left panel mark the infall zone and the infall trajectories of the fiducial model, respectively.
Other Images in This Article
Show More
Copyright and Terms & Conditions
© 2026. The Author(s). Published by the American Astronomical Society.

Copyright ©
2026 Astronomy Image Explorer. All Rights Reserved.
