

Image Details
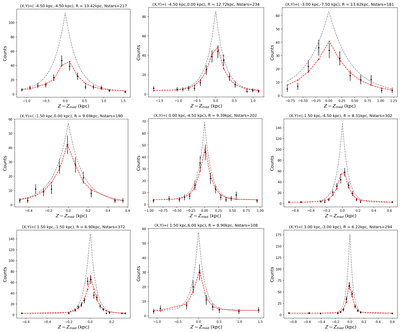
Caption: Figure 4.
Examples of fitted vertical distributions in individual cells. Each panel corresponds to a different cell in the XY-plane. For a given cell, the black points show the observed star counts along the vertical coordinate ﹩Z^{\prime} =Z-{Z}_{{\rm{m}}{\rm{e}}{\rm{d}}}﹩, where Zmed is the median Z of the stars in that cell. The red dashed line shows the best-fit model obtained in this work. For illustrative purposes only, the gray-dashed line shows the same best-fit model, but without accounting for the survey selection function and extinction.
Other Images in This Article
Show More
Copyright and Terms & Conditions
© 2026. The Author(s). Published by the American Astronomical Society.

Copyright ©
2026 Astronomy Image Explorer. All Rights Reserved.
