

Image Details
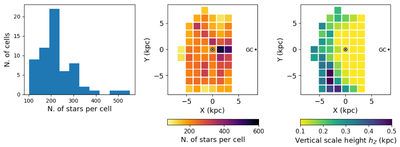
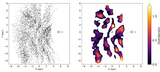
Caption: Figure 5.
Left panel: histogram of the number of stars per cell. Middle panel: distribution of the cells in the XY-plane, color coded by the number of stars per cell. The Sun’s position is at (X, Y) = (0, 0), and the Galactic center is to the right, at (X, Y)=(R⊙, 0), with R⊙ = 8.277 kpc (GRAVITY Collaboration et al. 2022). Right panel: same as the middle panel, but now color coded by the inferred hZ in each cell.
Other Images in This Article
Show More
Copyright and Terms & Conditions
© 2026. The Author(s). Published by the American Astronomical Society.

Copyright ©
2026 Astronomy Image Explorer. All Rights Reserved.
