

Image Details
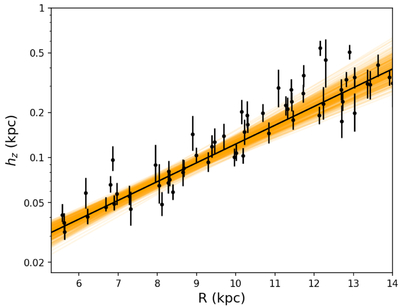
Caption: Figure 6.
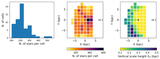
Obtained disk scale heights at different Galactocentric radii R. Each point corresponds to a cell in the middle and right panels of Figure 5. The black solid line shows the best-fit exponential model of the Galactic flare, and the transparent orange lines are obtained by drawing random samples from the uncertainties associated with hz0 and hfl, as explained in the text. Given that the y-axis is on a logarithmic scale, the exponential form adopted in Equation (10) appears as a linear function.
Other Images in This Article
Show More
Copyright and Terms & Conditions
© 2026. The Author(s). Published by the American Astronomical Society.

Copyright ©
2026 Astronomy Image Explorer. All Rights Reserved.
