

Image Details
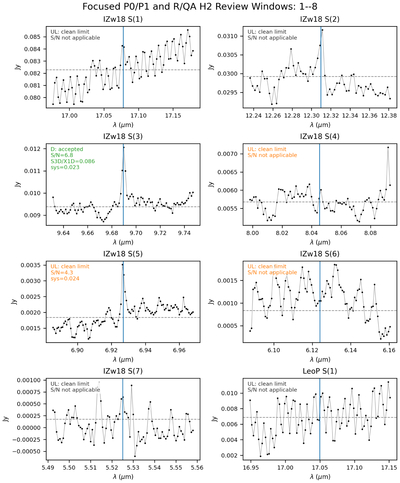
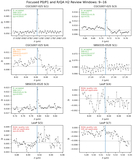
Caption: Figure D1.
Focused P0/P1 line windows and R/QA candidates used to construct the adopted conservative table, showing the first eight of 16 spectra. Green labels denote D, orange labels denote UL, and red labels denote R/QA. Label text color encodes the final disposition. The gray sampled-X1D trace and red fitted-Gaussian curve do not encode decision status. Each decision follows the full procedure in Section 3.2, rather than visual line height alone.
Other Images in This Article
Copyright and Terms & Conditions
© 2026. The Author(s). Published by the American Astronomical Society.

Copyright ©
2026 Astronomy Image Explorer. All Rights Reserved.
