

Image Details
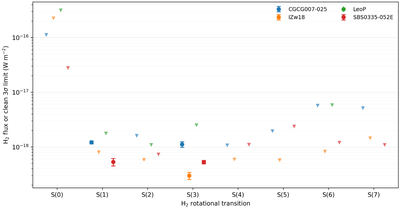
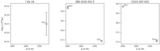
Caption: Figure 4.
Summary of the adopted H2 line inventory. Colors identify the four targets, as labeled in the legend. Filled circles show accepted X1D detections with empirical correlation-aware 1σ flux uncertainties; for the highest-S/N lines, the vertical error bars are smaller than the symbols. Downward triangles show clean 3σ-equivalent empirical upper limits. R/QA cases are retained in Table 7 as diagnostic records and are not plotted. The underlying decisions are defined in Section 3.2.
Other Images in This Article
Copyright and Terms & Conditions
© 2026. The Author(s). Published by the American Astronomical Society.

Copyright ©
2026 Astronomy Image Explorer. All Rights Reserved.
