

Image Details
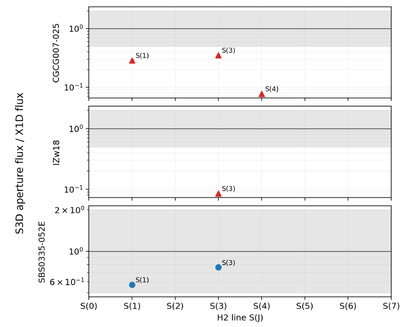
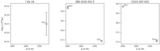
Caption: Figure 2.
Extraction-consistency diagnostic between adopted X1D and continuum-peak-centered S3D line fluxes. This comparison is not a photometric aperture correction. The plotted S3D/X1D ratio uses lines detected in both products. The S3D extraction is a circular 0﹩\mathop{.}\limits^{{\unicode{x02033}}}﹩8-radius aperture centered on the brightest median-continuum spaxel; it is a consistency diagnostic, not a flux-matched replacement for X1D. The gray band marks the factor of 2 review interval. Circles lie within that interval and triangles outside it receive an aperture-review flag; color does not encode final decision status. Lines detected in only one product are also flagged and assessed in the final decision table.
Other Images in This Article
Copyright and Terms & Conditions
© 2026. The Author(s). Published by the American Astronomical Society.

