

Image Details
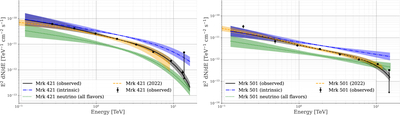
Caption: Figure 7.
The spectral energy distributions for Mrk 421 (left) and Mrk 501 (right). The fits for this work are solid black with their intrinsic spectra indicated in dashed–dotted blue. The orange dashed lines are the previous results from A. Albert et al. (2022). Lastly, the neutrino spectra from Section 6.1 are shown in green. One note is that Mrk 501 is modeled as a power law, but EBL absorption causes a cutoff to develop at approximately 10 TeV.
Other Images in This Article
Copyright and Terms & Conditions
© 2026. The Author(s). Published by the American Astronomical Society.

Copyright ©
2026 Astronomy Image Explorer. All Rights Reserved.
