

Image Details
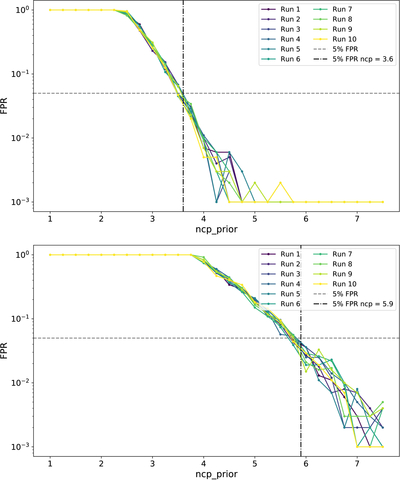
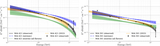
Caption: Figure 3.
The results for the 10 calibration runs for the 2.0 (upper) and 3.0 (lower) maps. For low ncp_prior values, both index fits return over a 100% FPR, which is floored to 1. As the ncp_prior increases, the FPR decreases until it crosses the 0.05 (5%) threshold, indicated by the dashed horizontal line. The value where this happens is indicated by the vertical dashed–dotted line and is 3.6 for the 2.0 maps and 5.9 for the 3.0 maps. If the FPR gets below 0.001, it is set to 0.001 for readability.
Other Images in This Article
Copyright and Terms & Conditions
© 2026. The Author(s). Published by the American Astronomical Society.

Copyright ©
2026 Astronomy Image Explorer. All Rights Reserved.
