

Image Details
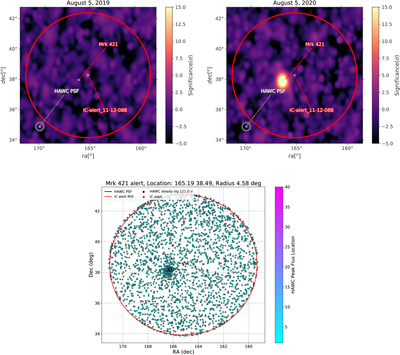
Caption: Figure 2.
The top two plots indicate two daily maps of Mrk 421, one where it is quiet (left) and one where it is flaring (right). The red circle indicates the IceCube alert’s ROI. HAWC’s PSF is indicated by the gray circle in the lower left corner. The bottom plot shows the frequency that a given R.A.–decl. has the maximum flux in the daily map. HAWC sees Mrk 421 to 121σ with the time-integrated dataset.
Other Images in This Article
Copyright and Terms & Conditions
© 2026. The Author(s). Published by the American Astronomical Society.

Copyright ©
2026 Astronomy Image Explorer. All Rights Reserved.
