

Image Details
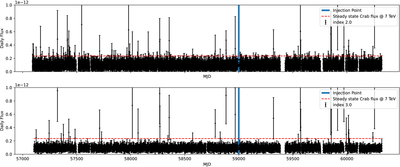
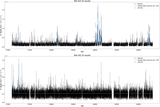
Caption: Figure 6.
Comparing the 2.0 (upper plot) and 3.0 (lower plot) datasets for the IceCube alert 24-04-24G used in the injection studies. The simulated Crab events are injected at MJD 59000, indicated by the vertical blue line.
Other Images in This Article
Copyright and Terms & Conditions
© 2026. The Author(s). Published by the American Astronomical Society.

Copyright ©
2026 Astronomy Image Explorer. All Rights Reserved.
