

Image Details
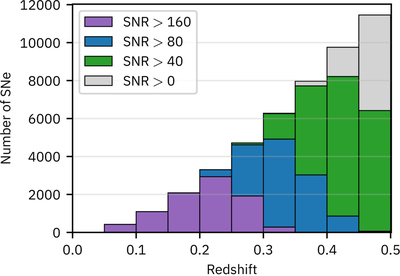
Caption: Figure 7.
Histogram of forecasted SNe Ia discovered in our simulations of Rubin’s high-activity WFD in the overlap region with DESI in 1 yr. Practically all SNe are well measured up to z = 0.35. The SNR values given here are defined to be the quadrature sum of all measurements of a single SN.
Other Images in This Article
Show More
Copyright and Terms & Conditions
© 2026. The Author(s). Published by the American Astronomical Society.

Copyright ©
2026 Astronomy Image Explorer. All Rights Reserved.
