

Image Details
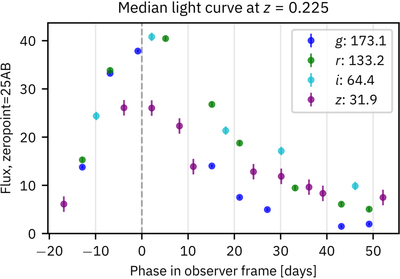
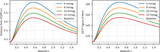
Caption: Figure 6.
Simulated light curve for a median SN Ia at z = 0.225, reflecting the (high-activity) WFD strategy to observe in pairs of filters every 3 days. These results are similar to other simulations, e.g., Figure 16 of (R. Kessler et al. 2019). Missing points reflect bright moon phases (affecting g, r, i predominantly), the possibility of an SN being missed due to chip gaps, and u and Y bands being excluded in our cosmology analysis. The numbers in the legend are the quadrature-summed signal-to-noise values per filter.
Other Images in This Article
Show More
Copyright and Terms & Conditions
© 2026. The Author(s). Published by the American Astronomical Society.

Copyright ©
2026 Astronomy Image Explorer. All Rights Reserved.
