

Image Details
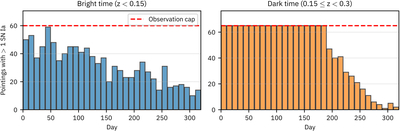
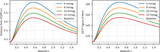
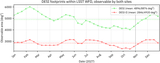
Caption: Figure 14.
Number of pointings with at least one near peak (±5 days) SN Ia per 10 day bin for bright (left) and dark (right) tiles, compared to the available observing time (red). For bright tiles, the small volume at z < 0.15 means that available tile pointings initially exceed the SN rate, but efficiency still decreases continuously as tiles are depleted. For dark tiles, the larger volume produces more SNe, so the program is initially limited by the possible observation time rather than by available tiles or SN counts. After roughly half a year, the depletion of tiles in the DESI/high-activity-WFD overlap region becomes the dominant bottleneck, limiting the number of SNe that can be followed up.
Other Images in This Article
Show More
Copyright and Terms & Conditions
© 2026. The Author(s). Published by the American Astronomical Society.

