

Image Details
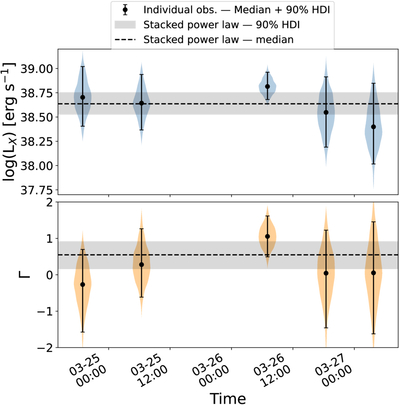
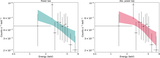
Caption: Figure 8.
X-ray luminosity (top) and photon index (bottom) derived from the X-ray fit of each ToO observation listed in Table 1. The full posterior is shown as a distribution, while the points represent the median, and the error bars correspond to the 90% HDI. The X-ray luminosity remains consistent across all five epochs within the uncertainties. The shaded area corresponds to the results of the fit to a stacking of all observations, using a simple power-law model.
Other Images in This Article
Copyright and Terms & Conditions
© 2026. The Author(s). Published by the American Astronomical Society.

Copyright ©
2026 Astronomy Image Explorer. All Rights Reserved.
