

Image Details
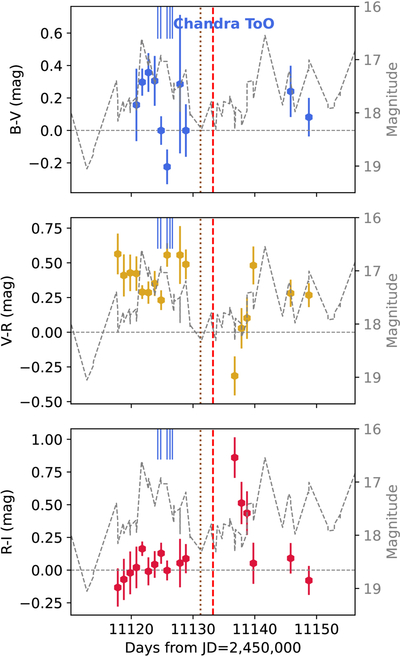
Caption: Figure 7.
Color evolution of AT 2016blu during its 2026 outburst. The data are obtained from Lick/KAIT, with magnitudes interpolated. The gray dashed line corresponds to that shown in Figure 4, representing the combined magnitude evolution from multiple telescopes. An anticorrelated evolution is observed between V − R and R − I: V − R transitions from red to blue and then reddens again, while R − I reddens from an initial value near zero before returning to nearly zero.
Other Images in This Article
Copyright and Terms & Conditions
© 2026. The Author(s). Published by the American Astronomical Society.

Copyright ©
2026 Astronomy Image Explorer. All Rights Reserved.
