

Image Details
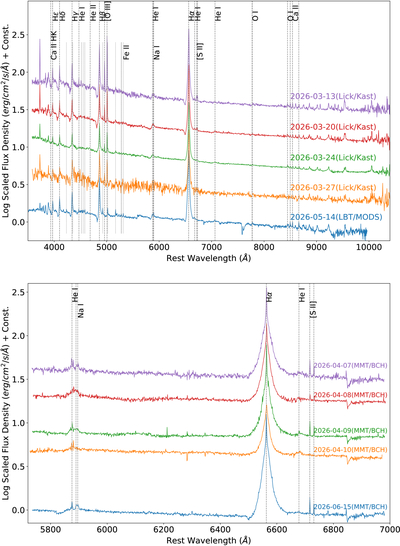
Caption: Figure 5.
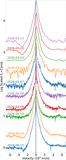
The top panel shows the optical spectra of AT 2016blu obtained with Lick/Kast during its 2026 March outburst, including some epochs obtained during the Chandra ToO observations (see Figure 4) and a later epoch obtained with LBT/MODS. The spectra exhibit Hα, He I, O I, Ca II, and [O III] lines. A P Cygni profile in Hα is present during the quiescent phase and at the optical peak, and becomes less prominent shortly thereafter as the system fades, while still remaining in the outburst phase. The bottom panel shows optical spectra obtained with MMT/BCH using the 1200 lines mm−1 grating prior to the second optical peak in April and later in June during a fainter optical peak. These spectra display He I emission lines but no obvious P Cygni profile in Hα until the final epoch obtained in 2026 June. The dip near 6860 Å is telluric absorption (B band).
Other Images in This Article
Copyright and Terms & Conditions
© 2026. The Author(s). Published by the American Astronomical Society.

