

Image Details
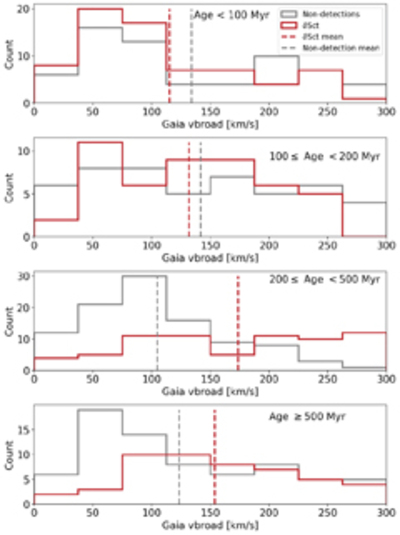
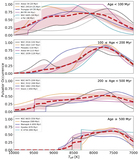
Caption: Figure 9.
Gaia vbroad histograms of the δ Scuti pulsators (red) and nondetections (gray) binned by age, with the youngest stars on top. The red and gray dashed lines show the mean distributions for the δ Scuti pulsators and nondetections, respectively. These histograms only include stars within the empirical bounds of the instability strip from S. J. Murphy et al. (2019).
Other Images in This Article
Copyright and Terms & Conditions
© 2026. The Author(s). Published by the American Astronomical Society.

Copyright ©
2026 Astronomy Image Explorer. All Rights Reserved.
