

Image Details
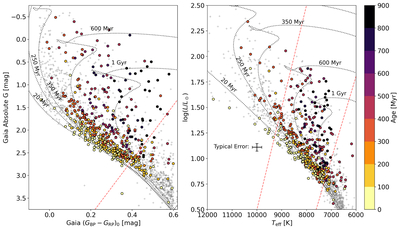
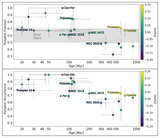
Caption: Figure 2.
Gaia CMD (left panel) and HR diagram (right panel) for all clusters studied in this work. Color-mapped points are δ Scuti pulsators, and colors show age. Gray crosses are nondetections. The black dotted curves show 40% critical rotation MIST isochrones (J. Choi et al. 2016; A. Dotter 2016) at various ages. In the left panel, the red dashed line shows the empirical red instability strip edge from K. Gootkin et al. (2024). In the right panel, the red dashed lines show the empirical bounds of the instability strip from S. J. Murphy et al. (2019).
Other Images in This Article
Copyright and Terms & Conditions
© 2026. The Author(s). Published by the American Astronomical Society.

Copyright ©
2026 Astronomy Image Explorer. All Rights Reserved.
