

Image Details
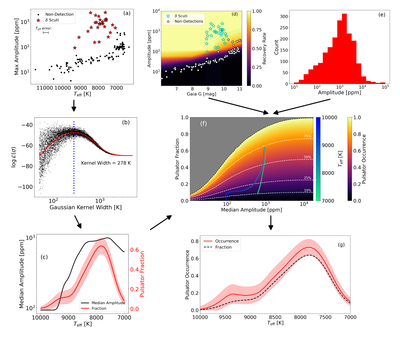
Caption: Figure 4.
Flowchart illustrating the procedures described in Section 3 for the open cluster NGC 6475. Panel (a) shows the maximum amplitude versus Teff. Red stars indicate δ Scuti pulsators, and black points show nondetections. Panel (b) shows the log-likelihood of the Bernoulli distribution (i.e., Equation (3)) as a function of the Gaussian kernel width from a Monte Carlo simulation. The red curve is the binned and smoothed log-likelihood, and the blue dotted line indicates the kernel width that maximizes the log-likelihood. Panel (c) shows the median amplitude and pulsator fraction as functions of Teff, using the optimized kernel width. Panel (d) shows δ Scuti recovery rates as a function of amplitude and apparent Gaia G magnitude. Cyan stars show δ Scuti stars, white circles show nondetections. The background colors show recovery rate. Panel (e) shows the δ Scuti amplitude distribution for all observed δ Scuti stars from Kepler (S. J. Murphy et al. 2019). Panel (f) shows the pulsator occurrence as a function of pulsator fraction and median amplitude. The inferno color map shows the pulsator occurrence. The median amplitudes and pulsator fractions from panel (c) are overplotted as the cyan and blue curve, which tracks Teff. Panel (g) shows the resulting pulsator occurrence as a function of Teff as the red curve. The pulsator fraction is also shown again as the black dashed curve. The red shaded region shows the counting error.
Other Images in This Article
Copyright and Terms & Conditions
© 2026. The Author(s). Published by the American Astronomical Society.

