

Image Details
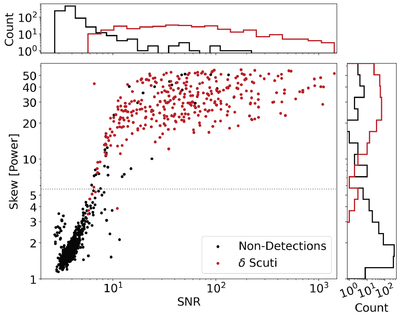
Caption: Figure 3.
Scatterplot of log skewness versus maximum SNR. Stars identified as δ Scuti pulsators are shown as the red points, and nondetections are shown as the black points. The distributions of log skewness and SNR for δ Scuti pulsators and nondetections are shown along each axis, with the same color scheme as the scatterplot. The gray dotted line marks log skewness = 0.75, which is the lower limit used when conducting the injection and recovery tests described in Section 3.3. This plot does not include stars in the Pleiades, NGC 2516, and NGC 3532, where the δ Scuti stars were identified in previous literature (T. R. Bedding et al. 2023; G. Li et al. 2024; I. Berry et al. 2025, respectively).
Other Images in This Article
Copyright and Terms & Conditions
© 2026. The Author(s). Published by the American Astronomical Society.

