

Image Details
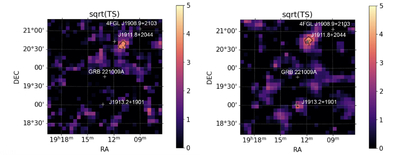
Caption: Figure 6.
Left panel: TS map (1 GeV–1 TeV) of the 3∘ × 3∘ region centered on GRB 221009A using 14.2 yr of preburst Fermi-LAT data. Right panel: TS map generated using LAT data from 5.73 to 456.69 days after the GBM trigger for GRB 221009A. In both cases, J1911.8+2044 and J1913.2+1901 are excluded from the model. The white cross in the center of the figure marks the location of GRB 221009A.
Other Images in This Article
Copyright and Terms & Conditions
© 2026. The Author(s). Published by the American Astronomical Society.

Copyright ©
2026 Astronomy Image Explorer. All Rights Reserved.
