

Image Details
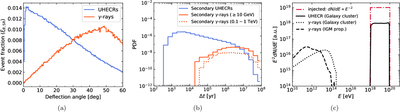
Caption: Figure 3.
UHECR (Ep ∼ 1018−1020 eV) injection model. (a) Distribution of the angle between the initial emission axis and the momentum vector of secondary UHECR and cascade photons at εγ > 10 GeV, after propagation in the magnetized region. (b) PDF of the time-delay distribution of secondary UHECRs and γ-rays emerging from the magnetized region with respect to the rectilinear travel time. (c) The solid line shows the secondary UHE proton spectrum after propagation through the galaxy-cluster region, and the dotted line shows the associated cascade γ-ray flux. Further propagation through the IGM produces the cosmogenic γ-ray flux at Earth, shown by the dashed line. The fluxes are normalized to 10 injected protons.
Other Images in This Article
Copyright and Terms & Conditions
© 2026. The Author(s). Published by the American Astronomical Society.

