

Image Details
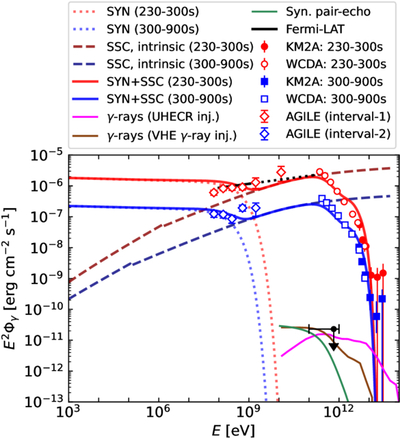
Caption: Figure 7.
LHAASO data (LHAASO Collaboration et al. 2023a) and Fermi-LAT detection (R. Pillera et al. 2022) in the 0.1–1 GeV range are shown. The filled black circle with a downward arrow represents the upper limit derived by Fermi-LAT for the 664.6 GeV photon at 0﹩\mathop{.}\limits^{{\unicode{x000b0}}}﹩75 offset 191.9 days post-trigger. The observed flux by the AGILE detector has been shown for 248–326 s (interval-1) and 326–980 s (interval-2) (M. Tavani et al. 2023). The synchrotron and SSC models are shown as dotted and dashed curves, respectively, while the solid curves correspond to the total, including EBL attenuation. The magenta and brown curves show UHE proton-induced cascade γ-rays from the structured region and intergalactic regions, respectively. The green curve shows the synchrotron pair echo emission.
Other Images in This Article
Copyright and Terms & Conditions
© 2026. The Author(s). Published by the American Astronomical Society.

