

Image Details
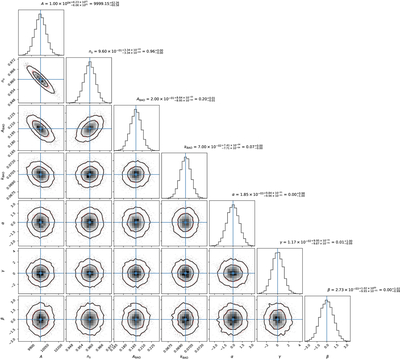
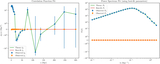
Caption: Figure 5.
Marginalized 1D and 2D constraints on the parameters A, ns, ABAO, kBAO, α, γ, and β from the Fisher matrix analysis, using a Euclid-/DESI-like survey. The 1D histograms show the posterior distributions, with titles indicating the median and 68% confidence intervals in scientific notation. The 2D plots show contours from samples and overlaid Gaussian ellipses (red solid for 68% and dashed for 95% confidence regions). Fiducial values are marked with lines.
Other Images in This Article
Copyright and Terms & Conditions
© 2026. The Author(s). Published by the American Astronomical Society.

Copyright ©
2026 Astronomy Image Explorer. All Rights Reserved.
