

Image Details
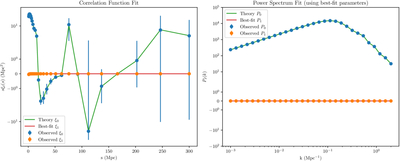
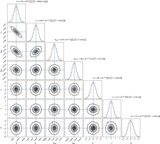
Caption: Figure 4.
Comparison of theoretical predictions and simulated data. Left: monopole ξ0(s) (solid) and dipole ξ1(s) (dashed), scaled by s2, vs. separation s (1–300 Mpc, 30 bins), with data points and 1% error bars. The BAO peak is at 100–150 Mpc. Right: monopole P0(k) (solid) and dipole P1(k) (dashed), scaled by k, vs. wavenumber k (0.001–2 Mpc−1, 30 bins), with data points and error bars. Best-fit parameters: α = γ = β = 0.0.
Other Images in This Article
Copyright and Terms & Conditions
© 2026. The Author(s). Published by the American Astronomical Society.

Copyright ©
2026 Astronomy Image Explorer. All Rights Reserved.
