

Image Details
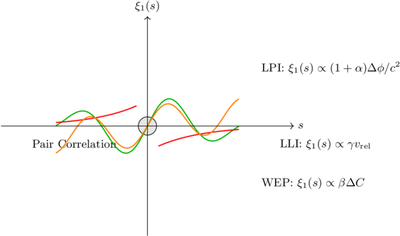
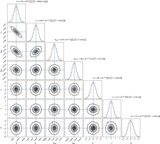
Caption: Figure 2.
Schematic illustration of the dipole contributions. LPI (green): oscillatory shape with a decaying envelope, reflecting the BAO wiggles of ξ0(s) modulated by 1/s2 from the potential gradient. LLI (red): negative, peaked at small separations and decaying as ∼1/s, representing ﹩{\xi }_{1}^{{\rm{LLI}}}\propto -\frac{\gamma }{{H}_{0}}\frac{{\sigma }_{v}}{s}{\xi }_{0}(s)﹩. WEP (orange): similar to LPI but drawn with an asymmetry to indicate that the sign and amplitude depend on the composition difference ΔC; in reality its functional form is identical to LPI up to a constant factor. All curves are schematic and not to scale; they are intended to highlight the distinct anisotropic patterns produced by each violation.
Other Images in This Article
Copyright and Terms & Conditions
© 2026. The Author(s). Published by the American Astronomical Society.

