

Image Details
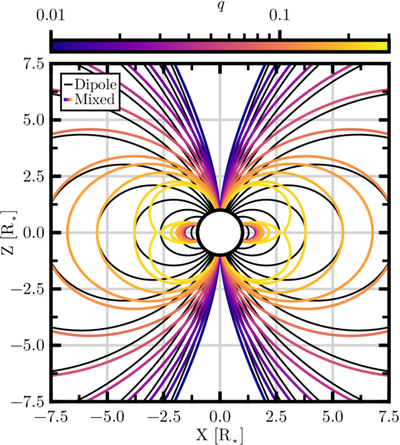
Caption: Figure 3.
The 2D spatial distribution of the magnetic field lines of the white dwarf. The dipole field is shown in black, while a mixed dipole–octopole field with Γ = 10 is shown as colored lines. The color of the mixed field indicates the q value that a field line corresponds to. Note that the small lobes of field at the equator share q values with the larger field lobes.
Other Images in This Article
Copyright and Terms & Conditions
© 2026. The Author(s). Published by the American Astronomical Society.

Copyright ©
2026 Astronomy Image Explorer. All Rights Reserved.
