

Image Details
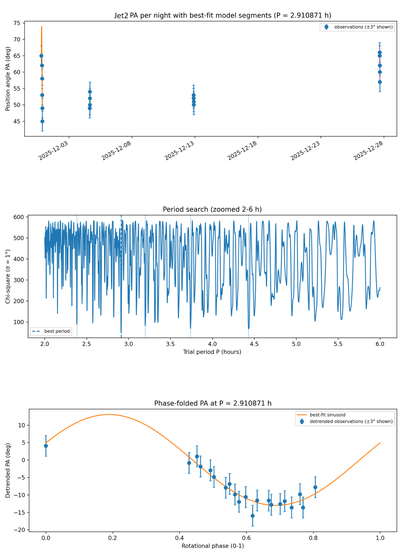
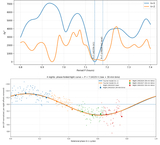
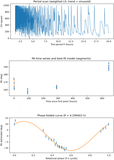
Caption: Figure 8.
Jet 1 diagnostic plots from the PA time series analysis: (top) PA versus time by observing segment with the best-fit model drawn within each night; (middle) period scan (2–6 hr zoom); (bottom) detrended phase fold at P2 = 2.9 hr. Error bars correspond to the reported ±3° values.
Other Images in This Article
Copyright and Terms & Conditions
© 2026. The Author(s). Published by the American Astronomical Society.

Copyright ©
2026 Astronomy Image Explorer. All Rights Reserved.
