

Image Details
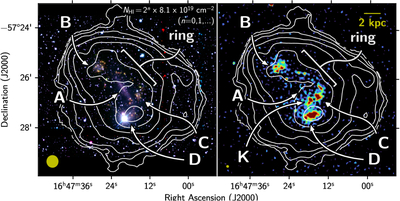
Caption: Figure 1.
H I column density contours from ASKAP/WALLABY overlaid on a composite RGB image from CTIO/DECam on the left and on the 1.4 GHz radio continuum from ASKAP/WALLABY on the right. In the left composite RGB image, the red channel corresponds to Hα, green to [O III], and blue to broadband V (as in Q. A. Parker et al. 2015). The H I contours are at column densities of 2n × 8.1 × 1019 cm−2 for n = 0, 1, 2, … , tracing the large-scale neutral gas envelope. The ASKAP synthesized beam is shown as a yellow filled circle in both panels: 30″ for the H I data and 6﹩\mathop{.}\limits^{{\unicode{x02033}}}﹩8 × 6﹩\mathop{.}\limits^{{\unicode{x02033}}}﹩3 for the radio continuum. The arrows indicate the positions of the galaxies (A), (B), (C), and (D) and the ring.
Other Images in This Article
Copyright and Terms & Conditions
© 2026. The Author(s). Published by the American Astronomical Society.

