

Image Details
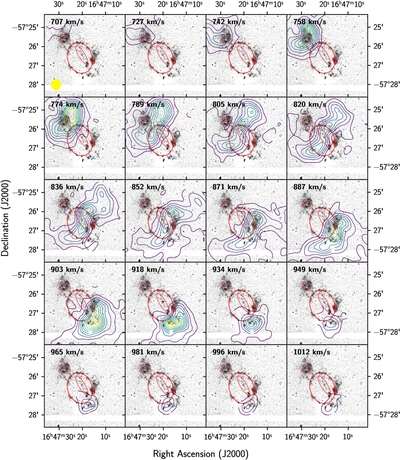
Caption: Figure 3.
Channel map of the H I emission for ESO 179-013. Each panel displays a 415″ × 415″ region with contours of the H I emission at different velocities. Contours are drawn at the [2.6, 6.1, …, 33.9] × 1019 cm−2 levels. The red ellipses mark the optical positions of the ring and galaxies A, B, and C. The beam is shown as a yellow circle in the first panel. The background image is the continuum-subtracted Hα from CTIO (Q. A. Parker et al. 2015), and the white strip marks a detector gap.
Other Images in This Article
Copyright and Terms & Conditions
© 2026. The Author(s). Published by the American Astronomical Society.

Copyright ©
2026 Astronomy Image Explorer. All Rights Reserved.
